In 2011, a young PGA trainee named Tom Davies saw something big in Barcelona. It was a big orange box and some Casio cameras. It was like seeing the monolith in 2001: A Space Odyssey. He was amazed.
This moment changed golf forever. Before, fitting clubs was all about guesses and stories. It was like trying to read tea leaves.
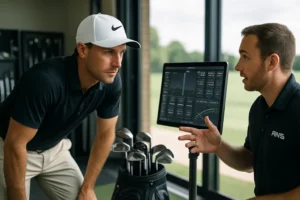
So, why use technology? It brought a common language to golf. “Feels too heavy” became about shaft weight. “I can’t get it airborne” turned into talks about launch and attack angles.
Tools like Trackman and its radar technology did more than add numbers. They explained why certain clubs worked better. This moved golf from personal taste to objective optimization for better accuracy, distance, and consistency.
It’s like the difference between a tailor guessing your size and using a tape measure. One is close, but the other is precise. With trusted data, as outlined in our privacy policy, you get a fit that boosts your confidence.
How Data Informs Decisions
The numbers after a swing can be enlightening or overwhelming. A Trackman screen shows evidence, not answers. It’s up to you to interpret it.
Think of swing metrics as the alphabet of a new language. You must learn the letters first. Club Speed, Ball Speed, and others tell the story of your swing.
| Metric | What It Measures | Primary Influence |
|---|---|---|
| Club Speed | Speed of the clubhead at impact | Potential distance (the engine’s horsepower) |
| Ball Speed | Speed of the ball after impact | Carry distance (the result of efficiency) |
| Attack Angle | Upward or downward movement of the club at impact | Launch angle and spin |
| Club Path | Direction the clubhead is moving (in-to-out or out-to-in) | Initial ball curvature |
| Face Angle | Direction the clubface is pointing at impact | Primary start direction of the ball |
| Dynamic Loft | Actual loft on the clubface at impact | Launch angle and spin (the presented loft) |
Amateurs often mistake high Club Speed for distance gains. But Ball Speed and Smash Factor reveal the truth. A powerful swing with poor contact is inefficient. A slower, centered strike is more effective.
Attack Angle and Dynamic Loft guide your ball flight. When they agree, you get a great trajectory. When they disagree, you get too much spin.

Collecting data is science. Interpreting it is an art. Tom Davies learned this the hard way. It’s about knowing which data to focus on.
Shouting about your club path is unnecessary. But noticing a pattern and choosing the right shaft is a decision. The data is your map. The fitter is your guide. For more on this, check out the ultimate guide to understanding Trackman.
Screenshots & Real Session Results
So what does this look like on the ground? Imagine a Trackman screen showing a flat 10-foot putt. The goal is to keep the Launch Direction consistent within a tiny margin. The real putting session data shows an average face angle of 0.17 degrees off. Two putts dropped, proving the stroke works.
This is where the rubber meets the green. The data is clean, but the application is chaotic. Remember John Daly’s snapped driver? That’s the secret of elite fitting. Technology gives the baseline, but people skills make it work.
The real session result isn’t just a chart. It’s a player like Michael Thompson, leading the PGA Tour in Strokes Gained Putting. It’s the A-star client whose wild spray pattern is now a tight cluster. The technology is the brush. The masterpiece is confidence.